The primary driving force for me to develop the Earthquake Dart Board was as a rebuttal to the earthquake forecasts of Stan Deyo. In this appendix I cover the method by which I determined the criteria for my predictions based on an analysis of historical maps made by Stan, and an analysis of Stan's success rate for the same period as my first 90 days of predictions.
Determining my prediction criteria
In order to do a proper comparison, I needed the characteristics of my predictions to be as similar as possible to Stan's. I needed a similar number of predictions per day, for the prediction windows to be the same length, and for the size of the prediction circles to be similar. However, most of these parameters varied from day to day on Stan's maps, so I decided to go by a long term average.
To determine the average characteristics of Stan's forecast maps, I downloaded 209 days worth of maps - those from 5-1-05 thru 10-22-05. This date range is actually more than 209 days, but there were several days where Stan did not publish any maps, or they simply were not archived.
Time Window
The length of all my prediction windows is the same as the length of Stan's - 5 days. This is as stated on each of Stan's maps.
Number of predictions per day
To determine how many predictions per day I should make, I simply determined the average number of circles per day that were on Stan's maps. This actually was not as simple as just counting circles. Although most of Stan's circles were circles or ellipses, several of the areas were formed from compound shapes. That is, two or more circles overlapped. Due to the method Stan used to draw the circles, only the outline of the compound shape is shown. I decided that such areas would not be counted as one, but rather as the sum total of the individual circles making the final shape.
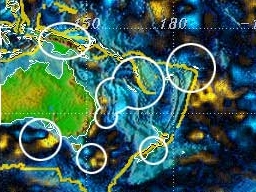 |
A section of a typical forecast map. Note that one area is composed of three overlapping circles. In counting the number of predictions for this section, I counted this as three individual circles that simply happened to overlap. Therefore this section has a total of 8 prediction circles. |
Now, it was simply a matter of tallying up the total number of circles per map, adding it all together, and dividing by the number of maps. The actual number of circles per map ranged from 0 to as many as 29 circles. The average was about 11.85 circles per day. Therefore, I decided that my maps would have exactly 11 predictions per day, every day, thus being similar too, but actually less than the historical long term average of Stan's maps.
Size of prediction circles
The size of Stan's circles varied quite a bit. Some were quite small, only a few hundred kilometers across. On occasion there were behemoths well over 4000 kilometers across. However, most circles were all about the same size, and were typically around 2000km diameter, or 1000km radius. Therefore I chose all my circles to be exactly 1000 km in radius.
Determining hits
Determining which quakes were hits or not should be something that is straight forward. Either it is a hit or it is not. Unfortunately, this is difficult to determine for Stan's maps. At first glance, one would expect that for the quake to be a hit, it should fall within the boundary of the mapped circles. However, Stan seems to employ a technique which I have called "close enough".
For example, on October 8th, 2005, a magnitude 7.6 quake struck the Hindu-Kush region of northern Pakistan. Stan claimed this quake as a hit. Since Stan's maps are good for five days, it was easy to examine previous maps to see if there was indeed a circle covering the region. Unfortunately, I could find none. The closest circle, which was posted two days prior, would have to have nearly doubled in size in order for the quake's epicenter to be inside of it.
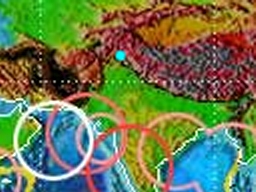 |
A 2x blowup of Stan's map from Oct 8, 2005, the day of the 7.6 Pakistan quake which was claimed as a hit. The epicenter is marked with the blue dot. As can be seen, the epicenter is outside of any of Stan's forecast circles. |
I contacted Stan via email to express my concern over this claimed hit, Stan's reply included the following statements,
- When a quake does occur and has been in or fairly close to the outer radius of a circle I have drawn over a given fault zone area then it is counted as a "hit".
- There is not doubt that the signal I reported for the Pakistan quake was a large one and it was a precursor to the Pakistan quake. And there is no doubt that I reported a warning for the region.
However, I chose to avoid such ambiguous criteria and decided to clearly state in the rules for my predictions that the boundary is defined as exactly 1000km distance from the center of my circles, which are given as latitude and longitude coordinates, and the formula for determining the distance between the prediction and the epicenter is given as well. That way there is no room for any sort of "close enough" strategies.
This "close enough" strategy plays a significant role in comparing my results for the first 90 days of my predictions to Stan's results for the same time period. But more on that in the comparison section below.
Magnitude criteria
Most of Stan's claimed hit's were for the larger quakes. Since he makes reference to the USGS recent quakes website, and the quakes listed there are greater than magnitude 4 globally, I decided to make my quake predictions for any quake magnitude 4 and above. However, Stan has also claimed hits for quakes as small as magnitude 2.8. But, I stayed with the criteria of M4.
Checking Stan's Results
Stan does not make a habit of publishing the results of his own predictions, rather just making claims for significant quakes as they occur. Therefore it was up to me to determine the accuracy of his claims. It was not an easy task to do so. Unlike my predictions, which were clearly defined, all I had to go on for Stan's predictions were the maps themselves. To avoid as much subjective judgment as possible, which could lead to questions about my fairness of the analysis of Stan's maps, I decided to automate as much of the process as possible.
First was dealing with the problem of "close enough". I have no idea what goes on in Stan's mind. I cannot determine objectively what Stan would consider a "close enough" hit or not. Therefore, I decided to eliminate the problem entirely. This also helps to balance the comparison of my results to his. I do not claim any hits for quakes outside my circles, therefore I will not consider any quakes outside of his circles.
Automated checking of hits by a computer program is a logical way to eliminate any guessing on my part. It also makes the process go much faster.
To begin with, I needed a way to tell the computer where Stan's circles were. Unlike my method where I state a latitude and longitude, all I have are some circles drawn on a map in Photoshop. Since image editing software was used to draw the circles, it made it easy for me to use such software to create an index map for the computer to use. It is obvious that Stan used a shape tool to draw the circles and ellipses on his maps. I used the same tool, but made sure the circles were solid, and not just outlines. I also did not use any anti-aliasing to make soft edges. I made my circles just large enough to completely cover Stan's circles. I did this on a separate editing layer so that I could then black out the background, leaving only two colors on the map - one representing areas that were outside of any predictions, and another representing areas that were in or on one of Stan's prediction circles.
 |
 |
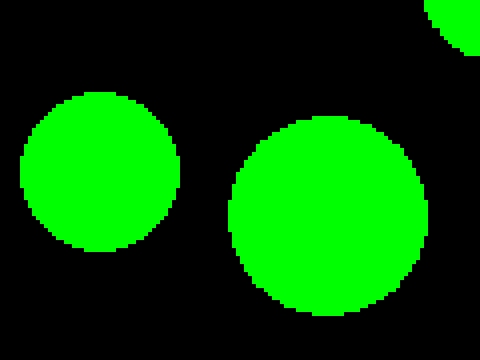 |
This
series of images shows how I made the index map based on Stan's maps.
The first frame is a section of one of Stan's maps. I then drew a solid
circle over his circles to match the dimension and just cover the
circle. The second image shows an intermediate mix of the two images. The third shows the index map as used by the computer to check for hits on Stan's maps. |
Now that I had my index map, all the computer had to do was to select a map, go through the list of earthquakes from the NEIC, compute the position on the map for the quakes epicenter, and determine the color for that quake's location. If the color was black, it was a miss. If it was green, it is counted as a hit. The computer automatically kept track of all the data and reported the results. This took care of determining the number of candidate quakes and the number of hits for Stan's maps for the time period in question. This gives the hit ratio.
To determine the successful prediction ratio still required a little work on my part. The program was designed to take the index map and generate a copy of that map but with circles plotted where the hits were. It was then a simple task for me to view each of these maps to determine the number of predictions that had hits. I had also counted the number of predictions made, and the ratio of these two gives the prediction success ratio.
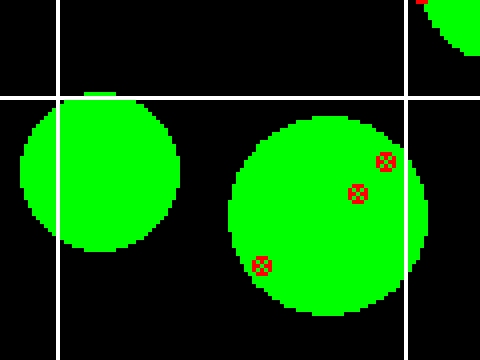 |
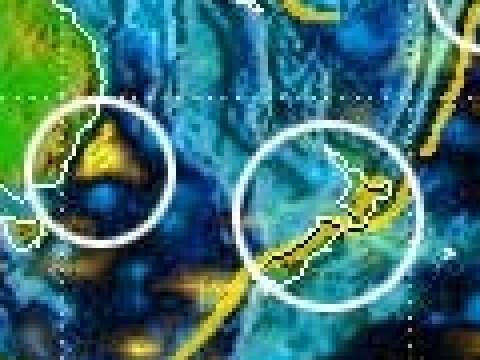
The result map for the same section as shown above. As can be seen, two of the three circles visible here had hits. Therefore the predictions success ratio for this section of one map would be 2/3, or 67%. |
My next concern is with the time window. It's a given that the time window is five days long. It says so right on his maps. I presume there is no fudge factor involved here. That is, if a quake occurs six days later it is not counted as a hit by Stan if it falls within one of his circles. I've never noticed this occurring.
However, I have no clue when his time windows start. I clearly define my windows down to the second. I only state the time to the minute, as the seconds are assumed to be zero. On Stan's website, he states that the data for which he bases his maps on "generally becomes available by 3:30pm Mountain." Further, he states that his "analysis should be uploaded by 6pm daily." I presume he means Mountain time there as well. So, generally, his maps are posted sometime between 3:30pm and 6:00pm Mountain time. I don't know when his maps are actually uploaded, so admittedly I am making a generalized assumption, but for this analysis I decided to assume that all his maps start at 6:00pm Mountain time, which during the time frame involved is 0100 UT the next day. All my maps are marked in UT and the analysis software works with UT time and Julian days. Conversion is a simple matter.
The Results
I'll just let the numbers speak for themselves. Here's the results:
|
Stan EQDB Number of predictions 873 990 Predictions with hits 337 650 Prediction/Hit ratio 38.60% 65.66% Number of candidate quakes 2571 2510 Number of quakes predicted 685 2276 Quake hit ratio 26.64% 90.68% |
Summary
Stan Deyo claims a high success rate for his forecasts. I don't know how he can claim this level of success when he doesn't even check for the hits himself! All he does is make a point of the few significant quakes that he happens to hit after checking places like the NEIC near real time quake list. Like he says here from an email,
- We only put up hits when we have time time to look. We know the process works 65-75% of the time; so we only put up hits to show people who are new. The circles are there and we feel that folks should do their own checking if they need to know the accuracy.
But does Stan care? Probably not. He still gets all the attention he wants by making his warnings and getting himself heard over late night talk radio shows. I think the following lines from a couple emails sum up his attitude,
- if you cannot deal with the way I forecast the seismic "weather" change the station and use their seismic forecast
- We work our butts off doing a whole heap of stuff you aren't even aware of every day. The earthquake forecast is a FREE service we offer to the public. We don't have to do it at all.
Analysis Details
This is the detailed analysis for each of Stan's 88 maps during the first 90 days of my EQDB project. There were two days he did not publish maps.
| Definitions: cand quakes - Number of candidate quakes within the time window for this map pred quakes - Number of candidate quakes successfully predicted hit ratio - Successful hit ratio # preds - Number of predictions for this map pred hits - Number of predictions that had at least one hit pred ratio - Successful prediction hit ratio Date cand pred hit # pred pred quakes quakes ratio preds hits ratio 051025 143 24 16.783% 13 7 53.846% 051026 168 14 8.333% 19 6 31.579% 051027 161 12 7.453% 10 4 40.000% 051028 150 7 4.667% 12 3 25.000% 051029 143 16 11.189% 14 5 35.714% 051030 153 2 1.307% 15 2 13.333% 051031 142 16 11.268% 6 3 50.000% 051101 124 10 8.065% 10 2 20.000% 051102 134 7 5.224% 10 3 30.000% 051103 145 3 2.069% 5 1 20.000% 051104 141 15 10.638% 14 6 42.857% 051107 167 16 9.581% 11 5 45.455% 051108 164 2 1.220% 3 2 66.667% 051109 162 6 3.704% 4 3 75.000% 051110 178 15 8.427% 4 2 50.000% 051111 177 2 1.130% 4 1 25.000% 051112 175 20 11.429% 10 4 40.000% 051113 166 5 3.012% 5 2 40.000% 051114 165 6 3.636% 9 4 44.444% 051115 160 9 5.625% 7 2 28.571% 051116 160 6 3.750% 12 3 25.000% 051117 163 15 9.202% 18 7 38.889% 051118 167 7 4.192% 11 5 45.455% 051119 174 8 4.598% 8 4 50.000% 051120 162 22 13.580% 9 6 66.667% 051121 165 9 5.455% 4 1 25.000% 051122 178 0 0.000% 4 0 00.000% 051123 179 18 10.056% 16 5 31.250% 051124 173 13 7.514% 9 4 44.444% 051125 180 9 5.000% 4 3 75.000% 051126 176 19 10.795% 13 8 61.538% 051127 163 12 7.362% 11 4 36.364% 051128 179 1 0.559% 2 1 50.000% 051129 192 13 6.771% 18 4 22.222% 051130 191 9 4.712% 13 3 23.077% 051201 186 17 9.140% 9 6 66.667% 051202 189 20 10.582% 13 5 38.462% 051203 176 28 15.909% 14 7 50.000% 051204 168 7 4.167% 10 3 30.000% 051205 162 29 17.901% 15 8 53.333% 051206 166 27 16.265% 13 7 53.846% 051207 166 21 12.651% 17 7 41.176% 051208 150 30 20.000% 14 9 64.286% 051209 153 16 10.458% 14 7 50.000% 051210 161 8 4.969% 5 4 80.000% 051211 168 10 5.952% 7 4 57.143% 051212 134 16 11.940% 13 8 61.538% 051213 112 8 7.143% 11 3 27.273% 051214 79 3 3.797% 8 2 25.000% 051215 40 4 10.000% 17 3 17.647% 051216 0 0 0.000% 12 0 00.000% 051217 0 0 0.000% 8 0 00.000% 051218 3 0 0.000% 6 0 00.000% 051219 29 10 34.483% 17 4 23.529% 051220 68 1 1.471% 10 1 10.000% 051221 123 5 4.065% 7 2 28.571% 051222 148 11 7.432% 11 3 27.273% 051223 173 27 15.607% 15 8 53.333% 051224 174 41 23.563% 18 10 55.556% 051225 166 14 8.434% 14 5 35.714% 051226 133 4 3.008% 12 2 16.667% 051227 134 17 12.687% 7 5 71.429% 051228 165 3 1.818% 8 1 12.500% 051229 160 12 7.500% 11 4 36.364% 051230 151 2 1.325% 1 1 100.000% 051231 156 7 4.487% 11 4 36.364% 060101 163 10 6.135% 11 5 45.455% 060102 131 10 7.634% 6 3 50.000% 060103 133 15 11.278% 11 6 54.545% 060104 140 12 8.571% 9 3 33.333% 060105 140 2 1.429% 5 2 40.000% 060106 138 8 5.797% 7 3 42.857% 060107 133 6 4.511% 11 6 54.545% 060108 135 6 4.444% 2 2 100.000% 060109 119 1 0.840% 9 2 22.222% 060110 102 15 14.706% 6 4 66.667% 060111 90 6 6.667% 6 3 50.000% 060112 85 13 15.294% 15 5 33.333% 060113 89 5 5.618% 7 2 28.571% 060114 92 11 11.957% 12 6 50.000% 060115 98 4 4.082% 8 3 37.500% 060116 96 3 3.125% 8 3 37.500% 060117 100 3 3.000% 8 2 25.000% 060118 88 9 10.227% 9 3 33.333% 060119 89 3 3.371% 9 3 33.333% 060120 84 6 7.143% 11 4 36.364% 060121 83 6 7.229% 9 5 55.556% 060122 78 8 10.256% 9 4 44.444% -------------------------------------------------- totals 2571 685 26.643% 873 337 38.603% |