This
section of
my website is where you will find information and links for my
interests in seismology, geology, and volcanology. Unlike my lasers
section, this is a new section and is still being developed and does
not have a large amount of stuff in it yet. I have had an interest in
these fields for many years but have been unable to devote any space on
my web site to it until recently.
|

 |
 |
 |
 |
 |
 |
| Brian's Seismic FAQ for sci.geo.earthquakes A
Frequently Asked Questions section to help answer questions from the
simple to (eventually) the complex. It's
a work in progess and many sections are still incomplete. I work on
this in small bursts so updates my be sporadic. Suggestions, comments,
and contributions welcome!
|
| Earthquake Dart Board NEW!!!
It has been
suggested (a challenge) that I try my own hand at predicting
earthquakes around the world. Follow the link to the page that will
document my educated wild ass guesses as I play a game of pin the quake
on the earth map.
|
| Topics: ECSZ Stress - Indonesian 9.0 04-12-26 - Mt. St. Helens Harmonic Tremor Sounds Mt. St. Helens Seismogram Archive - Parkfield - Adobe Hills (updated 12-29-04) - Papers & Publications Links |
|
ECSZ
Coulomb Stress and Subsequent Earthquakes
A map of the coulomb stress from significant earthquakes in the Eastern California Shear Zone from 1974 thru 1999 with epicenters of subsequent significant earthquakes. The base map was taken from a shockwave animation showing how the coulomb stress field changed over time as moderate to large earthquakes occured in the Mojave desert area of Southern California. The final quake in the sequence was the 1999 Hector Mine event. I then plotted on the map the locations of several significant earthquakes since then. It is very apparent that nearly all the events took place in regions of increased coulomb stress. Only the two Anza events occured in a region of lower stress. Two events are ambigious, appearing to occur on a highly focused boundary between increased and decreased stress zones. Based on this information, areas of concern could be the Southern San Andreas, the northern ends of the Elsinore fault and the San Jacinto fault zone, the eastern portion of the Garlock fault and areas north where there are numerous fault zones, including those responsible for the Coso Junction activity. 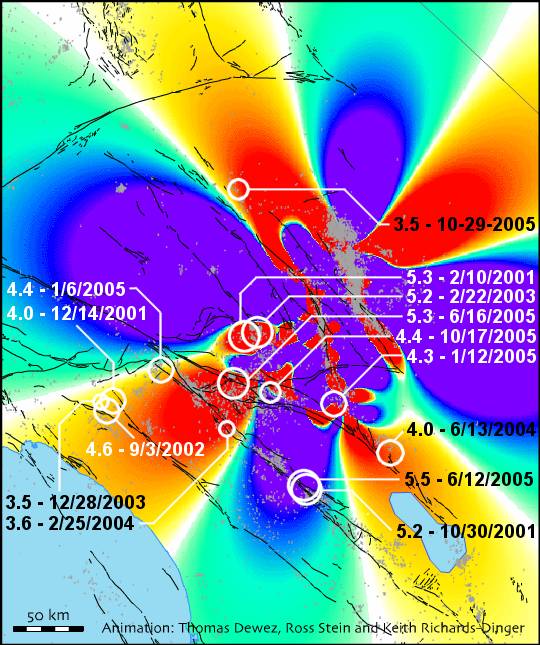 |
Map
from USGS of Indonesian 9.0 tectonic setting overlayed with NEIC map of
same region of 5.0+ quakes 1973 thru present. |
|
These are recordings from two Mt.
St. Helens seismographs turned into audio files.
NOTE: It has come to my attention that these anomalous signals are not representative of "harmonic tremor".
I am investigating to determine exactly what these signals represent. The two recordings were taken at the same time, Nov 20, 2004 starting at approximately 19:40 UTC and lasting approximately 1 hour and 20 minutes. Each of these recordings captured an example of harmonic tremor, most likely associated with the movement of magma beneath MSH. These seismographs record at a sampling rate of 100 times per second. That means the highest frequency recorded is only 50 Hz, which is just barely audible. Most of the sounds are below normal hearing range, but these audio files have been sped up 50x so that you can hear all the quakes, harmonic tremors, and other curious sounds. You also don't have to sit and listen for 100 minutes, but instead you can hear it all in only a little more than a minute and a half. By combining the two files into one stereo file, one can hear the difference in timing and pattern of the harmonic tremer as observed at each station. The minor quakes (sounding like small explosions) probably from the dome of MSH occur at the tame time on each channel, but the tremors occur at different times and have different characteristics. These files are in standard windows WAV format, 5000Hz/16 bit. Saint
Helens West (SHW) [973,088 bytes]
June Lake (JUN) [972,372 bytes] Both in Stereo (SHW on left, JUN on right) [1,946,132 bytes] What you are hearing The constant low frequency explosive sounds are the myriad of small earthquakes occuring in the dome area and are part of the dome forming process. The siren-like or whistle-like sounds are the harmonic tremors. Think of air flowing through a pipe organ. As the air flows through it sets up pressure waves within the confines of the pipe that resonate to a specific frequency depending on the dimensions of the pipe. In the case of a volcano, magma flowing through the magma channel is setting up vibrations that resonate through the channel. However, in the case of Mt. St. Helens, the sound is around 15 Hz, but since these recordings are sped up 50 times, the tremor is shifted to around 750 Hz.
Special thanks go to Randall Rathbun for providing the file conversion. |
|
This is a special page I've set up as an archive of
those
webicorder images I've been saving since the start of the Mt. Saint
Helens activity in September, 2004. |
|
Here are two GIF animations showing the hypocenters of the Parkfield sequence. The size of the spheres represents magnitude. Colors indicate the age of the quake. The color spectrum uses the rainbow with white added after violet. Red is oldest, white the newest. OLD red, orange, yellow, green, cyan, blue, violet, white NEW
|

|
I have created a new animation of the hypocenters in the Adobe Hills earthquake swarm. The data is current as of Dec. 27, 2004. This animation was created using a different method than my other animations allowing me to produce a better fly around effect with a 3-dimensional landscape. It's a large 9 megabyte file but should be well worth the download. 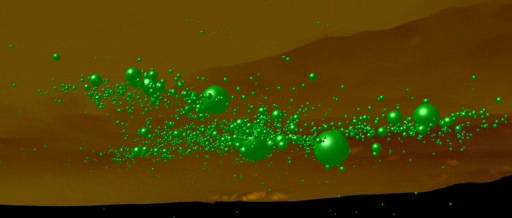 Frame Size: 512x218 (2.35:1 anamorphic) - File Size: 9,234,944 bytes
The thumbnails below link to 1024x768 jpeg images of the sequence from two different vantage points. Color indicates age, light blue being oldest, red being newest. Sphere size indicates magnitude.  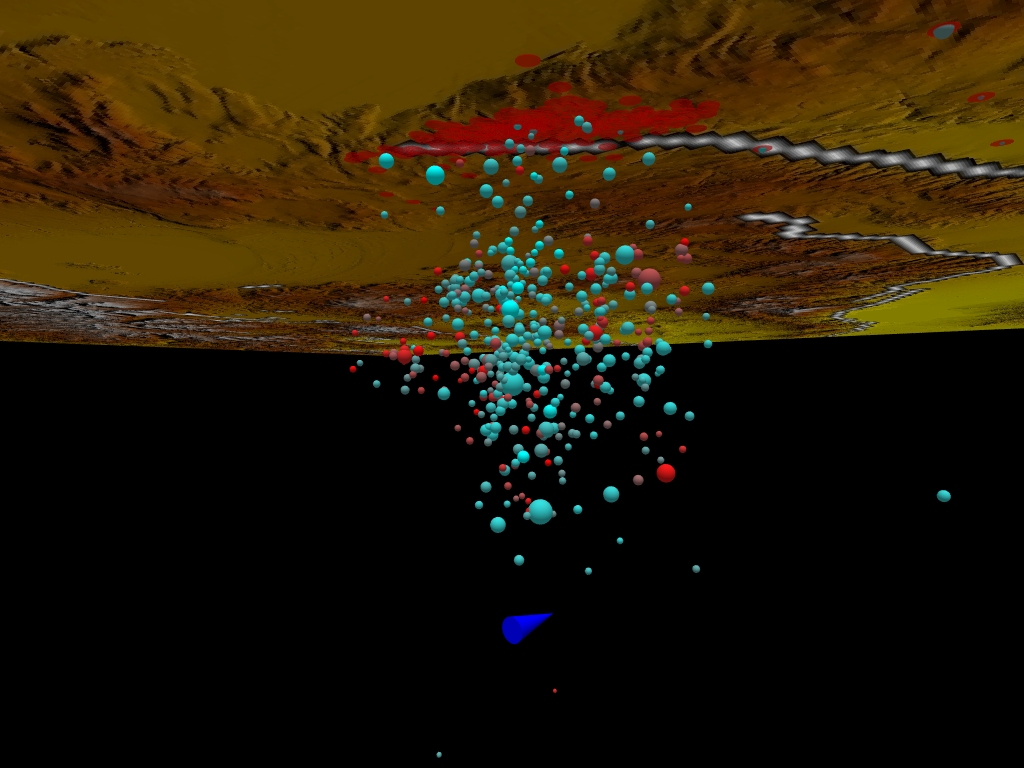 |
|
These are papers and publications by people in various
fields that I am hosting on my website. These are not links to other
sites.
Earth Tides Can Trigger Shallow Thrust Fault Earthquakes - Elizabeth S. Cochran, John E. Vidale, Sachiko Tanaka We show a correlation between the occurrence of shallow, thrust earthquakes and the occurrence of the strongest tides. The rate of earthquakes varies from the background rate by a factor of three with the tidal stress. The highest correlation is found when we assume a coefficient of friction of µ = 0.4 for the crust, although we see good correlation for µ between 0.2 and 0.6. Our results quantify the effect of applied stress on earthquake triggering, a key factor in understanding earthquake nucleation and cascades whereby one earthquake triggers others. Earthquakes and the Moon; Syzygy Predictions Fail the Test - Matthew Kennedy, John E. Vidale, Michael G. Parker For over 100 years, scientists have been searching for a temporal relation between earthquakes and the Earth Tides (Emter, 1997; Schuster, 1897). Such a relation is plausible because the tides wax and wane with predominantly diurnal (12-hour) and fortnightly (14-day) periods. This plausibility is strengthened by the fact that the stressing rates in the Earth’s crust resulting from the tides are far greater than from other known loads, such as tectonic plate motions (Vidale et al., 1998). DOWNLOAD 1,192,960 byte DOC file (Word Document) |
| Links NEIC:
Near Real Time Earthquake List - National Earthquake
Information Center, United States Geological Survey, global earthquakes
IRIS Seismic Monitor - Incorporated Research Institutions for Seismology, latest quakes worldwide map SCECDC - Southern California Earthquake Center, Data Center latest quakes map PNSN - Pacific Northwest Seismic Network, latest quakes map UAF Seismology Laboratory Home Page - University of Alaska, Fairbanks, recent earthquakes map Recent Earthquakes in Central US - Index Map - Center for Earthquake Research and Information, recent earthquakes map Recent Earthquakes in the Intermountain West - Index Map - Universtty Of Utah Seismic Stations, recent earthquakes map NEIC: Current Seismicity: United States - NEIC, US recent earthquakes map Recent World Earthquake Activity - Clicking to Regions - USGS, recent earthquakes map USGS Earthquake Hazards Program-Home - USGS Advanced National Seismic System, recent earthquakes map West Coast & Alaska Tsunami Warning Center - Palmer, Alaska - tsunami warnings for the Pacific NCSN - Drum Recorder Data Selector - Northern California Seismic Network |